Просмотр новости
Найдите то, что Вас интересует
 Спутники
 РН
РН SpaceX
 Роскосмос
 NASA
NASA
СпутникиРНSpaceXРоскосмосNASAThis is part of a larger report on the attitudes and dynamics shaping the 2026 midterm elections. With several weeks to go until Election Day, Americans who are registered to vote favor Democrats over Republicans in the national race for the House of Representatives by an 8 percentage point margin (44% to 36%). About two-in-ten […]
This is part of a larger report on the attitudes and dynamics shaping the 2026 midterm elections.
With several weeks to go until Election Day, Americans who are registered to vote favor Democrats over Republicans in the national race for the House of Representatives by an 8 percentage point margin (44% to 36%). About two-in-ten registered voters say they would vote for a third-party candidate or are not sure.
Midterm vote preferences in key demographic groups
% of registered voters who say that if the election were held today, they would vote for the __ for U.S. House of Representatives in their district
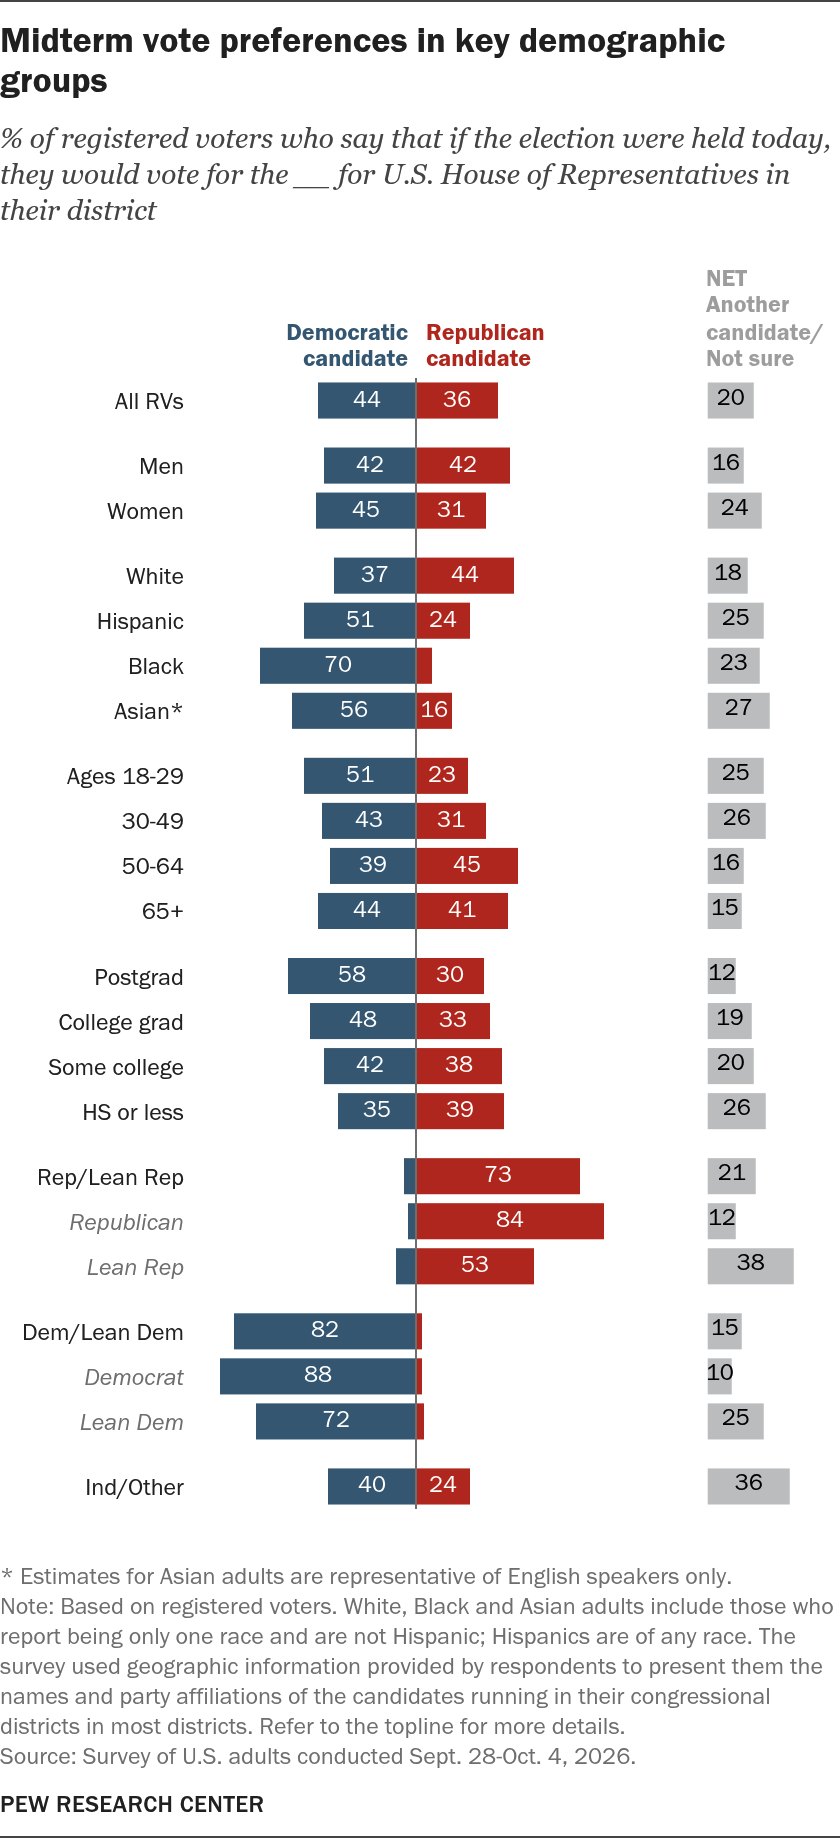
* Estimates for Asian adults are representative of English speakers only.
Note: Based on registered voters. White, Black and Asian adults include those who report being only one race and are not Hispanic; Hispanics are of any race. The survey used geographic information provided by respondents to present them the names and party affiliations of the candidates running in their congressional districts in most districts. Refer to the topline for more details.
Source: Survey of U.S. adults conducted Sept. 28-Oct. 4, 2026.
PEW RESEARCH CENTER
Midterm vote preferences in key demographic groups
% of registered voters who say that if the election were held today, they would vote for the __ for U.S. House of Representatives in their district
| Group | Democratic candidate | Republican candidate | Another candidate | Not sure | NET Another candidate/Not sure | Group |
|---|---|---|---|---|---|---|
| All RVs | 44 | 36 | 5 | 15 | 20 | total |
| Men | 42 | 42 | 4 | 12 | 16 | gender |
| Women | 45 | 31 | 5 | 19 | 24 | gender |
| White | 37 | 44 | 4 | 14 | 18 | race |
| Hispanic | 51 | 24 | 7 | 18 | 25 | race |
| Black | 70 | 7 | 6 | 17 | 23 | race |
| Asian* | 56 | 16 | 5 | 23 | 27 | race |
| Ages 18-29 | 51 | 23 | 4 | 21 | 25 | age |
| 30-49 | 43 | 31 | 6 | 20 | 26 | age |
| 50-64 | 39 | 45 | 4 | 12 | 16 | age |
| 65+ | 44 | 41 | 5 | 10 | 15 | age |
| Postgrad | 58 | 30 | 3 | 9 | 12 | ed |
| College grad | 48 | 33 | 4 | 15 | 19 | ed |
| Some college | 42 | 38 | 5 | 15 | 20 | ed |
| HS or less | 35 | 39 | 6 | 20 | 26 | ed |
| Rep/Lean Rep | 6 | 73 | 5 | 15 | 21 | rep |
| Republican | 4 | 84 | 3 | 9 | 12 | rep |
| Lean Rep | 9 | 53 | 9 | 28 | 38 | rep |
| Dem/Lean Dem | 82 | 2 | 3 | 12 | 15 | dem |
| Democrat | 88 | 2 | 2 | 8 | 10 | dem |
| Lean Dem | 72 | 3 | 6 | 19 | 25 | dem |
| Ind/Other | 40 | 24 | 8 | 27 | 36 | other |
* Estimates for Asian adults are representative of English speakers only.
Note: Based on registered voters. White, Black and Asian adults include those who report being only one race and are not Hispanic; Hispanics are of any race. The survey used geographic information provided by respondents to present them the names and party affiliations of the candidates running in their congressional districts in most districts. Refer to the topline for more details.
Source: Survey of U.S. adults conducted Sept. 28-Oct. 4, 2026.
PEW RESEARCH CENTER
This analysis is among all registered voters – many of whom will not turn out in this November’s midterm elections. For example, 46% of those eligible voted in the 2022 midterm elections.
While those who turn out in elections often differ from those who do not, including in their vote choice, the ways groups of voters overall view the choice illustrate wide – and familiar – differences in voting preferences by gender, race, education, age and political party.
Gender
Men are evenly divided: 42% say they would vote for the Democratic candidate in their district, and 42% say they would vote for the Republican.
Women support Democratic candidates by a 14-point margin, 45% vs. 31% for Republicans.
Race and ethnicity
White voters tilt toward Republicans, 44% to 37%.
Among Hispanic voters, Democratic candidates hold a 51% to 24% advantage. A quarter of Hispanic voters say they would support another candidate or are not sure.
In the 2024 presidential election, Hispanic voters were nearly evenly split in their vote preference. But in previous midterm and presidential elections over the past two decades, they have supported Democrats by considerable margins.
Seven-in-ten Black voters support Democratic candidates, while 7% back Republicans.
Among Asian voters, 56% support Democrats, and 16% choose Republicans. A combined 27% would vote for another candidate or are not sure.
Age
As in previous midterm elections, younger voters tilt Democratic. Voters ages 50 and older are more divided:
Education
Like in recent elections, voters with bachelor’s degrees or more education are more likely than those with less education to support Democratic candidates.
Democrats have a wide advantage among voters with a postgraduate degree (58% vs. Republicans’ 30%). They also have a sizable, though narrower, advantage among voters with a bachelor’s degree but without a postgraduate degree (48% to 33%).
Voters who attended some college but do not have bachelor’s degrees (42% for Democrats and 38% for Republicans) and voters who did not attend college (35% for Democrats and 39% for Republicans) are more divided.
Party identification
Though very few voters who identify with or lean toward a political party say they would vote for the other party’s congressional candidates, Democrats and Democratic-leaning independents are more united than their GOP counterparts.
Among Republicans and Republican leaners, 73% prefer Republican candidates, while 6% prefer Democrats. About two-in-ten would pick another candidate or are not sure.
By contrast, 82% of Democrats and Democratic leaners say they would vote for Democratic candidates, and just 2% would vote for Republicans. About 15% prefer another candidate or are not sure.
For more information on groups’ congressional vote preferences, refer to the detailed tables.
For this survey, respondents were presented with the names and partisan affiliations of the major-party candidates on the ballot in their congressional district, based on geographic information they provided. They were also presented with options to choose “another candidate” or say they were not sure.
Respondents in Alaska (where there are four candidates on the general election ballot), Louisiana and Missouri (where a late change to the congressional map has resulted in an open, majority-vote primary held in November) received generic Republican and Democratic candidate choices. In districts where one of the two major parties did not field a candidate, respondents were given the option to choose a generic member of the party opposite the named candidate in their district.
Voters who are highly attentive to this year’s elections favor Democrats by a wide margin.
Voters who are highly engaged in midterms are particularly supportive of Democratic candidates
% of registered voters who say that if the election were held today, they would vote for the __ for U.S. House of Representatives in their district
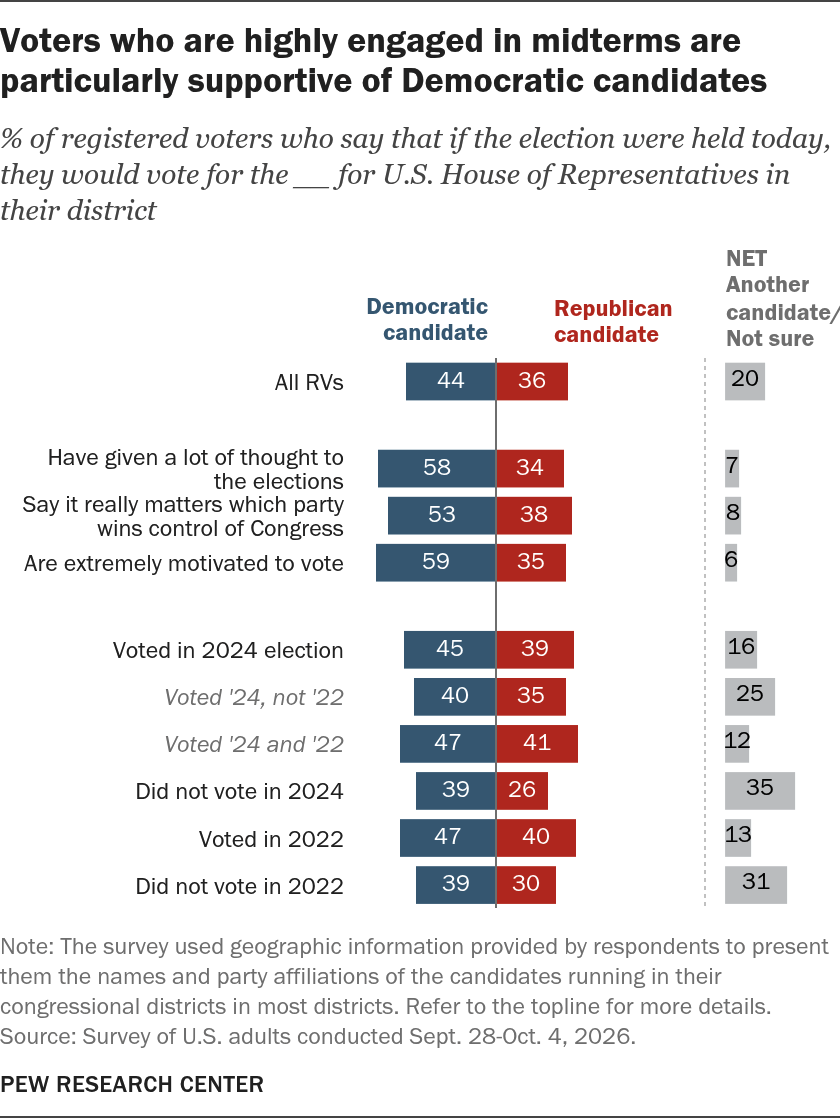
Note: The survey used geographic information provided by respondents to present them the names and party affiliations of the candidates running in their congressional districts in most districts. Refer to the topline for more details.
Source: Survey of U.S. adults conducted Sept. 28-Oct. 4, 2026.
PEW RESEARCH CENTER
Voters who are highly engaged in midterms are particularly supportive of Democratic candidates
% of registered voters who say that if the election were held today, they would vote for the __ for U.S. House of Representatives in their district
| Group | Republican candidate | Democratic candidate | Another candidate | Not sure | NET Another candidate/Not sure | grouping |
|---|---|---|---|---|---|---|
| All RVs | 36 | 44 | 5 | 15 | 20 | 1 |
| Have given a lot of thought to the elections | 34 | 58 | 4 | 4 | 7 | 2 |
| Say it really matters which party wins control of Congress | 38 | 53 | 3 | 5 | 8 | 2 |
| Are extremely motivated to vote | 35 | 59 | 3 | 3 | 6 | 2 |
| Voted in 2024 election | 39 | 45 | 4 | 11 | 16 | 3 |
| Voted ’24, not ’22 | 35 | 40 | 6 | 19 | 25 | 3 |
| Voted ’24 and ’22 | 41 | 47 | 4 | 8 | 12 | 3 |
| Did not vote in 2024 | 26 | 39 | 6 | 29 | 35 | 3 |
| Voted in 2022 | 40 | 47 | 4 | 9 | 13 | 3 |
| Did not vote in 2022 | 30 | 39 | 6 | 25 | 31 | 3 |
Note: The survey used geographic information provided by respondents to present them the names and party affiliations of the candidates running in their congressional districts in most districts. Refer to the topline for more details.
Source: Survey of U.S. adults conducted Sept. 28-Oct. 4, 2026.
PEW RESEARCH CENTER
The Democratic advantage is not as wide among all those who turned out to vote in either the most recent presidential (2024) or midterm (2022) elections.
Vote preference among highly engaged voters
Democrats’ leads contrast the last midterm elections in 2022, when voters who said it really mattered who won or were extremely motivated were evenly divided in their preferences, and those who had given a lot of thought tilted to GOP candidates.
Vote preference and turnout in recent elections
Compared with Democrats’ wide advantages among the most engaged voters, Democrats hold more modest leads among voters who have a validated record of voting in the 2024 presidential election (45% to 39%) and those who voted in both 2024 and 2022 (47% to 41%).
Democrats also lead among voters who didn’t vote in 2024 or 2022. However, roughly one-in-three of these 2024 or 2022 nonvoters say they support a third-party candidate or are not sure – a larger share than those who voted in 2024 (16%) or 2022 (13%).
| # | Наименование новости | Тональность | Информативность | Дата публикации |
|---|---|---|---|---|
| 1 | With Americans in a Sour Mood, Democratic Voters Are More Engaged in Midterms | 0 | 12.91 | 08-10-2026 |
| 2 | Economy Ranks as Top Issue in Midterms for All Voters – But Partisans Differ Over the Importance of Other Issues | 0 | 6.66 | 08-10-2026 |
| 3 | 🗳️ Where voters stand ahead of the midterms | 0 | 8.93 | 09-10-2026 |
| 4 | Republicans trail Democrats by 12 points in battle for House: Poll | 0 | 7.91 | 29-09-2026 |
| 5 | Following the Funds: Spending shows where parties look to flip seats in Va., NC | 0 | 9.22 | 26-09-2026 |
| 6 | The Hill: Более половины опрошенных избирателей в США поддерживают демократов | 0 | 10.76 | 30-09-2026 |
| 7 | Американцы хотят контроля Демпартии в палате представителей, показал опрос | 0 | 6.69 | 30-09-2026 |
| 8 | Midterm temperature check 30 days out, with DDHQ | 0 | 11.87 | 05-10-2026 |
| 9 | Your Questions Answered: How the ACLU Is Safeguarding the 2026 Midterms | 0 | 9.23 | 29-09-2026 |
| 10 | What to Know About Mail-In Voting for the 2026 Midterms | 0 | 16.72 | 16-09-2026 |